Can someone explain whether the GPU driver is obliged to release GPU memory on demand from an application program? If not, does that kindof nullify any GPU memory resource management that an application might want to do, since it is a “layer removed” from the actual memory?
I’m allocating lots of textures and then freeing them. When allocating I can see the “GPU System Bytes” (in Process Explorer) rapidly increase (to an amount that hugely surpasses the images hard disk space - maybe they are uncompressed in GPU so take lots of space).
When freeing the texturtes, I can see the Texture2D object destructor correctly calls glDeleteTexture, but there seems to be a delay in the “GPU System Bytes” reducing back to the original value and in fact, the value does not return to the original value, it hovers above it a bit.
And then if keep doing this, I see the GPU memory usage gradually increases, but all the while, I am counting my glDeleteTexture calls, and the memory never quite seems to get recovered.
I am bamboozled, because from the app side it looks clean - x allocated, x freed - but I am seeing my application become a bit of resource hog, not in my process’s memory space, but the GPU memory space, because of this (Intel HD 6000 GPU).
tracking GPU memory precisely is not really possible. The system software does not have access to that information, as far as I know. It can only guess. Things might be slightly different for integrated GPU’s like your Intel HD 6000. It uses part of your system memory to store textures. Discrete GPU’s like those from NVIDIA and AMD have their own memory, which is usually quite a bit faster. The driver manages this memory and (again, as far as I know) there is no way to get detailed information on how much is in use.
By the way, you’re right that a texture on disk is far smaller than in GPU memory. A 1024x1024 JPEG image might be just a few kilobytes when compressed, but will be at least 3MB (1024 x 1024 x 3 bytes) in uncompressed GPU memory. Both DirectX and OpenGL support compressed texture formats, but you’ll have to specifically ask for them on creation and they use a different compression scheme (as in: not JPG or PNG) for fast decompression on the GPU when they need to be rendered.
As long as you’re making sure you delete textures as soon as you no longer need them, you should be good. Don’t trust reported memory too much.
Thanks for replying. Then it seems I may have hit the upper bounds on what I can get from the hardware/driver which is good enough for me.
Regarding the compressed formats. You have me curious and will read up on this. It seems like it may be a huge win for my application to get the GPU mem down, especially, if I cant really control actual memory usage directly.
The way I create textures at the moment is as follows:
I’ve not really looked into formats yet until now (will definitely check out your link, thanks). Regarding the above code, which format does this end up creating? Are you aware of any good examples in Cinder of this as a starting point?
The format that is used by default is simply GL_RGB8 or GL_RGBA8 (depending on whether the source image has an alpha channel). The format uses a single byte per color channel, with a value between 0 and 255 that, on the GPU, will be interpreted as a floating point value between 0 and 1. This is called normalized integer.
Hi, I’ve been playing around with this for a while, having modified the mipmapping both ways. Whilst it may have an impact on performance, the memory usage is still high. I think it may be driver related (see below).
What I am observing now, is that before execution of my application the “Current” system wide commit charge usage (as reported by Process Explorer) indicates approx 2-3 GB memory usage. This rises dramatically during usage of the application to 17 GB (which seems dodgy to me, but my free count == my allocate count so not sure whats going on there). However, when my application’s process terminates, I would expect the “Current” to be reset back to 2-3 GB. Instead, what I am observing in Process Explorer is that the memory usage stays high (approx 17 GB) after the process has terminated, requiring a reboot cycle to reset back to 2-3 GB.
Because the memory usage is high after my process terminates, I’m led to believe that the memory leak may be in a Windows driver (in this case probably the Intel graphics driver).
Would you agree with this assessment of the situation? Is it even possible for an application to use(/misuse) a driver in a manner to cause side effects depending on the driver quality?
I would just run it on another GPU to see what the differences are, but I only have 1 laptop to test, and was wondering if you had came across any dodgy drivers before?
Thanks for any pointers/advice/further debugging strategies - Laythe
stuff like this is really hard to assess. It could be anything, really. Maybe even a process or application that’s running in the background, or not under your control. If the memory build-up is caused by your application, and you’re sure you’re properly deallocating your memory, it could indeed be a driver issue.
I recently ran an application that loaded huge 4k PNG sequences and a quick calculation told me it wasn’t going to fit in my GPU memory. Still, the driver did most of the hard work, swapping textures in and out for me. I could tell, because even though I had preloaded all textures, the animation was still quite choppy. I would not be surprised if this kind of abuse would cause memory leaks here and there.
To really know if you have a memory leak, use a debugger tool. Visual Studio has the Diagnostic Tools, for example. The Process Explorer can not be trusted.
Yep, I realise my question is not really specific enough. Apologies for that - really, i’m clutching at straws trying to build confidence in the code. Having not much experience in graphics, i’m getting the impression its maybe a bit naive to think I can do that, with only one test GPU. Although the code runs fine and “debugs OK” it leaves behind a potentially massive dent in the commit charge after the process ends, which I don’t want to do to any user’s PC.
I’m curious as to why don’t you trust process explorer? Its “as close as we can get” to the actual OS to know whats going on. I did the Performance Analysis in visual studio tools, both memory and CPU. The CPU is spending all its time in the texture create/load functions which is all as expected - there is nothing obvious in the memory allocations either (No hugely sized allocation/no large number of allocations. Also gl texture allocates == gl texture deallocates) which is why I can only think of a driver issue…I guess I must find another test pc (victim!).
Cheers for the interesting chat - Laythe
EDIT:
I’m loading JPG’s mostly - I’ve came across many online sources that seem to indicate an optimal texture format of BGRA for JPGs as it then does not have to rearrange the bytes. I’ve output the internal format of the textures created from the JPG images and this is RGB. So I’m thinking maybe Cinder converts any and all formats to RGB for the sake of being generic despite suboptimal. I’m currently digging around Cinder to try and see if a BGR(A) to RGB(A) conversion is occurring. Glad I have the Cinder code (thanks Cinder!). I guess it must be. If I find it, then is it possible in cinder to specify this texture format as BGR(A) to minimise any conversions before texture upload - or is this a bit too low level for Cinder? I had a look at Texture.cpp and still trying to understand how it all works “under the hood”.
The conversion from BGR(A) to RGB(A), or any other conversion really, can be found in the Surface class.
The reason I take the Process Explorer with a pinch of salt, is that GPU memory is not CPU memory. In the near future, when we are all using Vulkan and DirectX 12, we will have more control over our memory. But an OpenGL driver is just a black box and it can do whatever it wants. Finally, the Process Explorer is just not precise enough. As a general tool to measure memory it’s fine, but for debugging I recommend using proper tools like the one mentioned.
Oh yeah, I’ve heard about Vulkan/DX12. Knowing my luck, by the time I’ve got my head around all this stuff it will be time to start again with Vulkan/DX12!
Have I lost the ability to set the format (and thus are defaulting to a less optimal RGB format, therefore triggering a byte ordering step) due to my use of convenience methods?
I’m not sure whether this is a continuation of this post, or a seperate question.
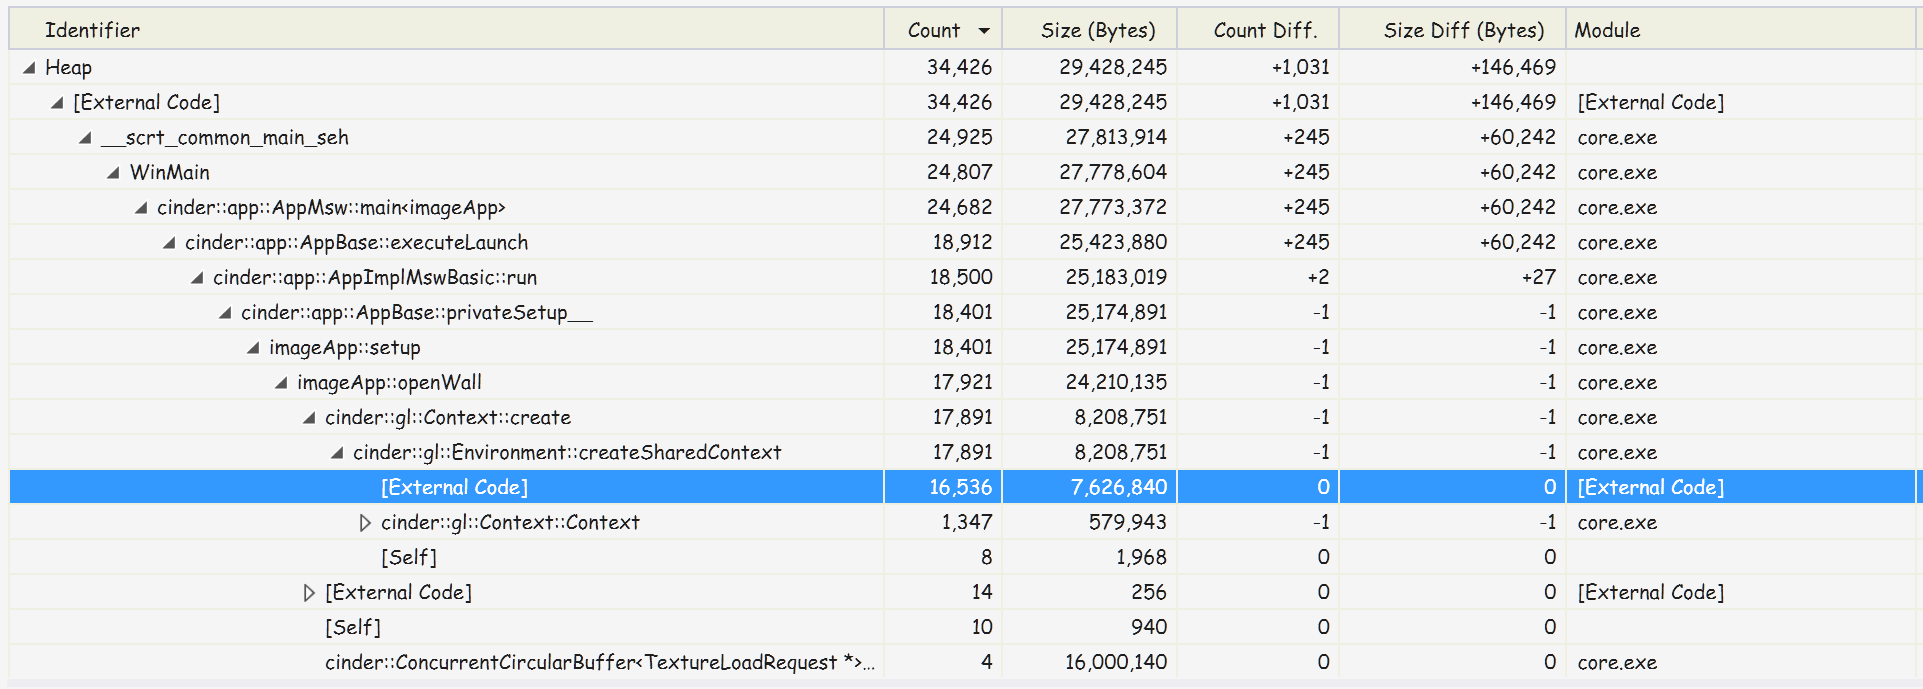
I’ve done some further debugging/profiling after reading your comments and I’m seeing that createSharedContext() causes an unusually large amount of allocations:
This is with only 1 texture loaded, but the results are similar with no textures loaded - ie approx 17891 from createSharedContext. This made me question my use of threads/contexts. the imageApp::openWall() method you can see in the trace above is roughly:
// room for 30000 requests
mTextureLoaderRequests = new ConcurrentCircularBuffer<TextureLoadRequest*>(TEXTURE_LOADER_REQUEST_Q_SIZE);
mTextureLoaderRequests2 = new ConcurrentCircularBuffer<TextureLoadRequest*>(TEXTURE_LOADER_REQUEST_Q_SIZE);
mTextureLoaderRequests3 = new ConcurrentCircularBuffer<TextureLoadRequest*>(TEXTURE_LOADER_REQUEST_Q_SIZE);
mTextureUnloaderRequests4 = new ConcurrentCircularBuffer<TextureLoadRequest*>(TEXTURE_LOADER_REQUEST_Q_SIZE);

// create and launch the texture loader thread with a new gl::Context just for that thread
mTextureLoaderBackgroundCtx = gl::Context::create(gl::context());
mTextureLoaderBackgroundCtx2 = gl::Context::create(gl::context());
mTextureLoaderBackgroundCtx3 = gl::Context::create(gl::context());
mTextureUnloaderBackgroundCtx4 = gl::Context::create(gl::context());

mTextureLoaderThread = shared_ptr<thread>(new thread(bind(&imageApp::textureLoaderThreadFn, this, mTextureLoaderBackgroundCtx)));
mTextureLoaderThread2 = shared_ptr<thread>(new thread(bind(&imageApp::textureLoaderThreadFn2, this, mTextureLoaderBackgroundCtx2)));
mTextureLoaderThread3 = shared_ptr<thread>(new thread(bind(&imageApp::textureLoaderThreadFn3, this, mTextureLoaderBackgroundCtx3)));
mTextureUnloaderThread4 = shared_ptr<thread>(new thread(bind(&imageApp::textureUnloaderThreadFn4, this, mTextureUnloaderBackgroundCtx4)));
I cant see how, but is this usage of shared contexts between threads somehow causing the crazy amount of allocations, or is this valid usage of shared contexts?
When i start getting nervous about allocations I drop in a global debug allocator so i can see what’s happening. My engine has a more formalised version of this, but the meat of it is overriding operator new and breaking (or logging) on big allocations. A quick and dirty but accurate way of tracking your specific allocations rather than relying on external tools. Apologies if this is too basic and you’ve already gone down this path.
*edit this was meant for your question about checking for unnecessary copies in your Surface, I doubt it will be too helpful with the shared context stuff
Hey Lithium.Snepo - thanks for your help. I’ve not even tried this mainly because I thought (/think) that if the private memory usage of the application is low during usage (never approaching 17GB - whilst the system commit does) and that the commit usage is high after the process exits I thought “it can’t be a leak in the application”.
But:
a) my understanding could be wrong.
b) will try adding your snippet and see what that shows.